My first “proper” post to this blog was on September 5th 2022 (I don’t count the test post from August 2nd). A week later, I retired from my role at Autodesk. It’s hard to believe that I’ve been doing this for a year.
The Plan
I initially had three ideas for projects I might like to work on. The first was for a serverless, super-scalable cloud spreadsheet. That would be interesting and challenging in itself. However, the real reason for doing it was to extend the functionality beyond that of a spreadsheet to a general dataflow processing system.
The second idea was to take what I’d learnt building the Navisworks graphics engine and reimagine it using the latest in computer graphics hardware and APIs.
The third idea was to go back to my original research on indexing and querying multi-dimensional data. In large part, this was driven by my frustration developing database driven apps that needed to sort and filter data using multiple fields. This seemed to be a common problem (judging by the number of times during my career that we ended up building another version of it) but seemingly without a satisfactory solution using existing databases. Maybe I could build a Postgres extension to solve the problem?
There were three reasons for having a blog. First, I could use it to document my progress. There’s huge value in simply writing things down. Thinking through whatever your latest breakthrough is so that you can explain it to someone else. Second, I wanted it to be a way of keeping in touch with my former colleagues. I’d seen too many people leave Autodesk with promises to keep in touch and then never heard from them again. I thought a blog would be an easy way for anyone vaguely interested to keep track of what I was up to. Finally, all my projects are open source. If I got anywhere with them, a blog would be a way of attracting potential collaborators.
What Happened?
Much to my surprise, the blog has dominated my time. I’ve always been an advocate for working out as much as you can on paper before writing any code. Scribbled notes and diagrams are quick to generate and much easier to change than code. As I started on my projects, I turned my previous “working out on paper” into blog posts. And just kept going. It seems that little bit of extra rigor involved in writing up a blog post is enough of a foundation to keep building. As I finished one post, it would spark off ideas for three more.
I absolutely believed I’d spend at most three months planning and working things out before starting to write code. As it’s turned out, I haven’t yet felt the need to write code.
The spreadsheet project has got to the point where I think I’ve figured out the mechanics of how to store and retrieve large spreadsheets of data. I could start writing code for that. On the other hand, I haven’t started writing up my ideas for how evaluation of formulas will work …
I’ve decided to use Unreal Engine as the starting point for the graphics project. I compiled it from source code and was on the verge of writing some hello world type code before being sidetracked by the other two projects.
The database project hasn’t got any further than documenting all the unsatisfactory solutions I’ve seen over the course of my career.
I’ve thoroughly enjoyed the process of writing. Somehow I’ve found the time to cover another ten topics beyond the three projects I started out with. By my count, I’ve published 50 posts over the course of the year. I’ve settled on a routine that works for me, and happily fills my days as I potter around, picking things up and putting them down whenever I feel like it.
Engagement
How has the blog worked for keeping in touch?
I hadn’t appreciated how one sided it would feel. I have analytics that show how many people look at each post, which I’ll share next. However, it’s all anonymous and feels kind of unreal. The only thing that really shows how people are engaging with my content is reactions and comments. More importantly, it’s the only thing that tells me who is reading it. There’s a wonderful feeling of connection and recognition when I see a comment from someone I know.
So please, hit that like button, leave a comment. It really does make a difference to me.
Testimonials
Here’s a few of the comments over the year that made my day. Thank you for taking the time.
Making sense of British keyboard layouts on the Mac
Thank you for writing this - I’ve battled with Karabiner every time I’ve set up a new Mac over the years and this has been a really helpful deep dive onto how it works!
Connor Barthelmie
The Evolution of Multi-Tenant Architecture
Nice post! Looking forward to the rest of the series.
Kean Walmsley
Modern SaaS Architecture
Great article, Tim! I always enjoy reading your blogs. One aspect that can be challenging in the “deploy in customer account” model is a simple strategy to push updates to your binaries. And if your solution allows some kind of way for the customer to build customizations or extensions on it, then the problem becomes even more tricky.
Monmohan Singh
Free or Not?
Thanks Tim! This is such an enjoyable reading, with so much condensed information! I am tempted to start my own source project with this guidance as a quick boostrap. :)
Wayne Wang
Organizational Anti-Patterns #1: VP Moves
Great summary, Tim! Your article actually made me pause and reflect on opportunities for doing differently.
Arno Zinke
Organizational Anti-Patterns #2: The Old New Thing
This is essentially why I left Autodesk, except without the good view that someone in a reasonably strategic position has, at my level it looked more like:
- Year 1 : We make submarines!
- Year 2 : Did we say “submarines”? We meant helicopters…
- Year 3 : Turns out some customers were using the submarines, meet the heli-sub.
- Year 4 : The industry is turning against awkward multi-function vehicles…
- Year 5 : We make toasters!
Ian Badcoe
This post has great and very true observations. But what is the solution or even the root of the problem? A corporation cannot stop trying New Things - if it did, it would remain one product company. Do you think the root problem is short attention span and lack of conviction to ride over the Trough of Disillusionment to see if the Plateau of Productivity will be eventually reached and how high it will be? Would smaller number of larger bets with more conviction be a solution? Peter Thiel talked about something similar from the venture capitalist PoV. He observed that their smaller investments (less conviction, smaller commitment) has higher failure rate than larger investments.
Arkady Gilman
Organizational Anti-Patterns #5: The Future Platform
So much of this resonates. #toosoon
Brandon Cole
Organizational Anti-Patterns #7: Product Managers
Love that story Tim :)
Ilai Rotbaein
From Navisworks to Nanite
Great summary Tim. Looking forward to Navis on Nanite
Ashwin Bhat
One of the neat advantages of working on a Nanite for BIM is that your triangle clusters can be associated with building metadata to help you make more informed decisions at the Cull and Simplify steps. The way someone is expected to inspect window mullions for example is very different than what they might do with a mechanical pump skid.
Angel Say
A Career in Business Cards
A wonderful journey with enviable achievements. :)
Wayne Wang
My Desk Setup
This is great Tim; thanks for sharing; curious to know if you use any software to split the screen layout on your big monitor?
Krishna Kumar
DynamoDB Database Grid View
Just sent your article series to my team! We too have one of those grid views. Thanks for publishing these!
Ben Asher
Excellent analysis with attention to detail. Thank you, Tim
Arno Zinke
Analytics
I have previous analytic reviews after two months and six months. You might want to check those out to compare and contrast.
Users
I found the best way to understand changes in the number of visits to the blog is to look at the metrics quarter by quarter.
Q1 (September 6th 2022 - December 5th 2022)
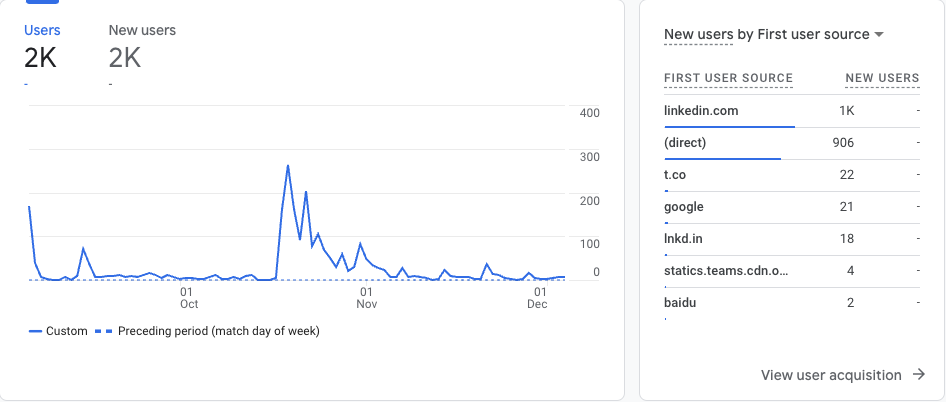

The first quarter was dominated by the initial flurry of visitors when I announced my retirement and then my blockbuster post The Seven Reasons why I REALLY left Autodesk. It’ll take another couple of quarters before the tremors disappear.
Most visitors came via LinkedIn or direct (presumably from my retirement announcement email).
Q2 (December 6th 2022 - March 6th 2023)
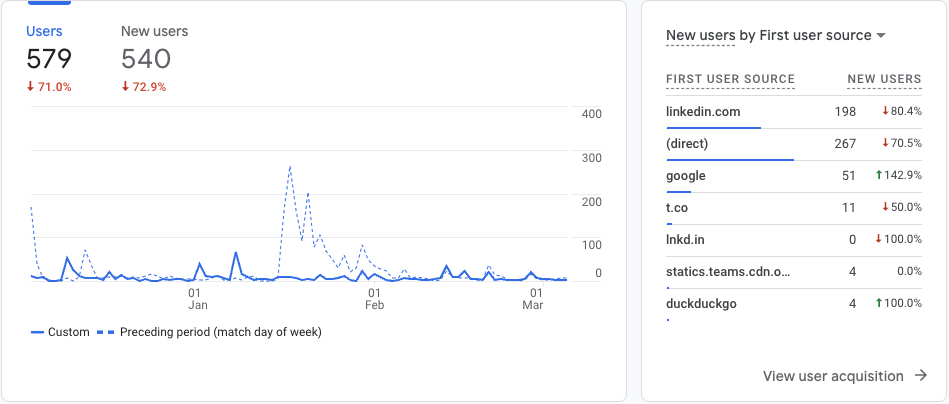

A real disappointment compared to the previous quarter but a more realistic picture of visitor behavior. Visitors are still predominantly via LinkedIn or direct but you can start to see Google Search having an impact.
Q3 (March 7th 2023 - June 5th 2023)
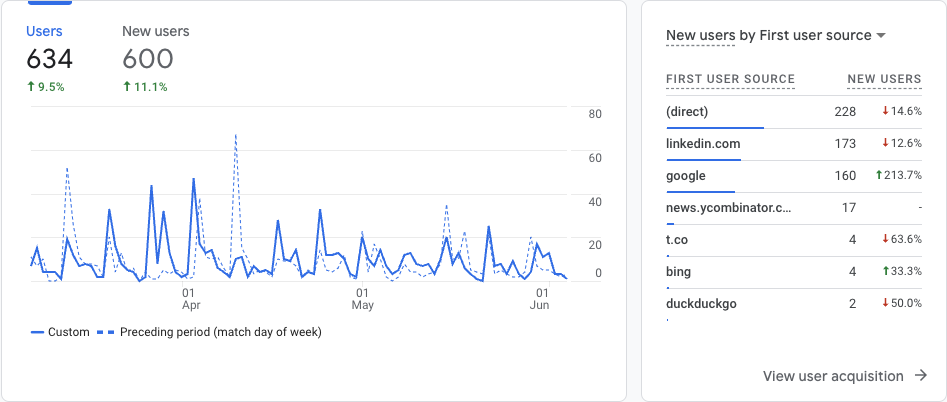

A little bit of growth over the previous quarter, driven by a tripling of traffic from Google. Feeling optimistic again.
Q4 (June 6th 2023 - September 3rd 2023)
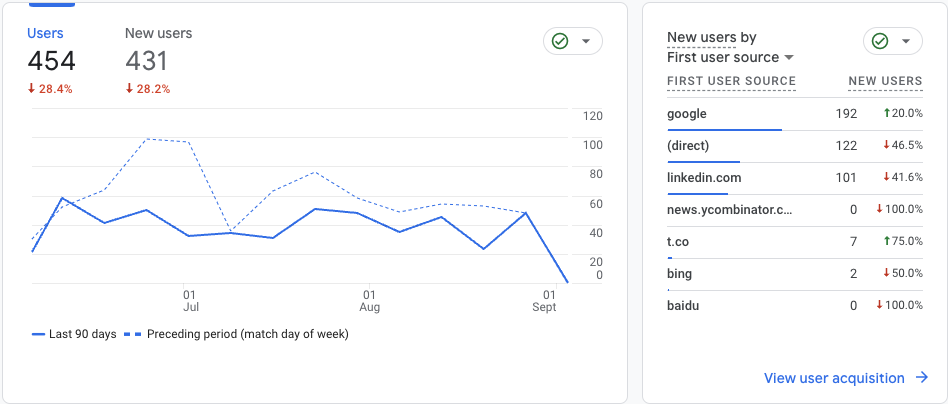

Oh dear, that doesn’t look good. Google is still growing but LinkedIn and direct traffic has fallen off a cliff.
Is this the impact of the summer holiday season? Or a result of writing nothing but insanely detailed posts on cloud spreadsheet implementation and database internals?
Demographics (December 6th 2022 - September 3rd 2023)


I decided to look at user demographics over the last three quarters, stripping out the unsustainably high numbers from the first quarter. The distribution is pretty much the same as in my previous analytic reviews.
Posts (September 3rd 2022 - September 3rd 2023)
Now, the moment you’ve all been waiting for. Which are the most popular posts?
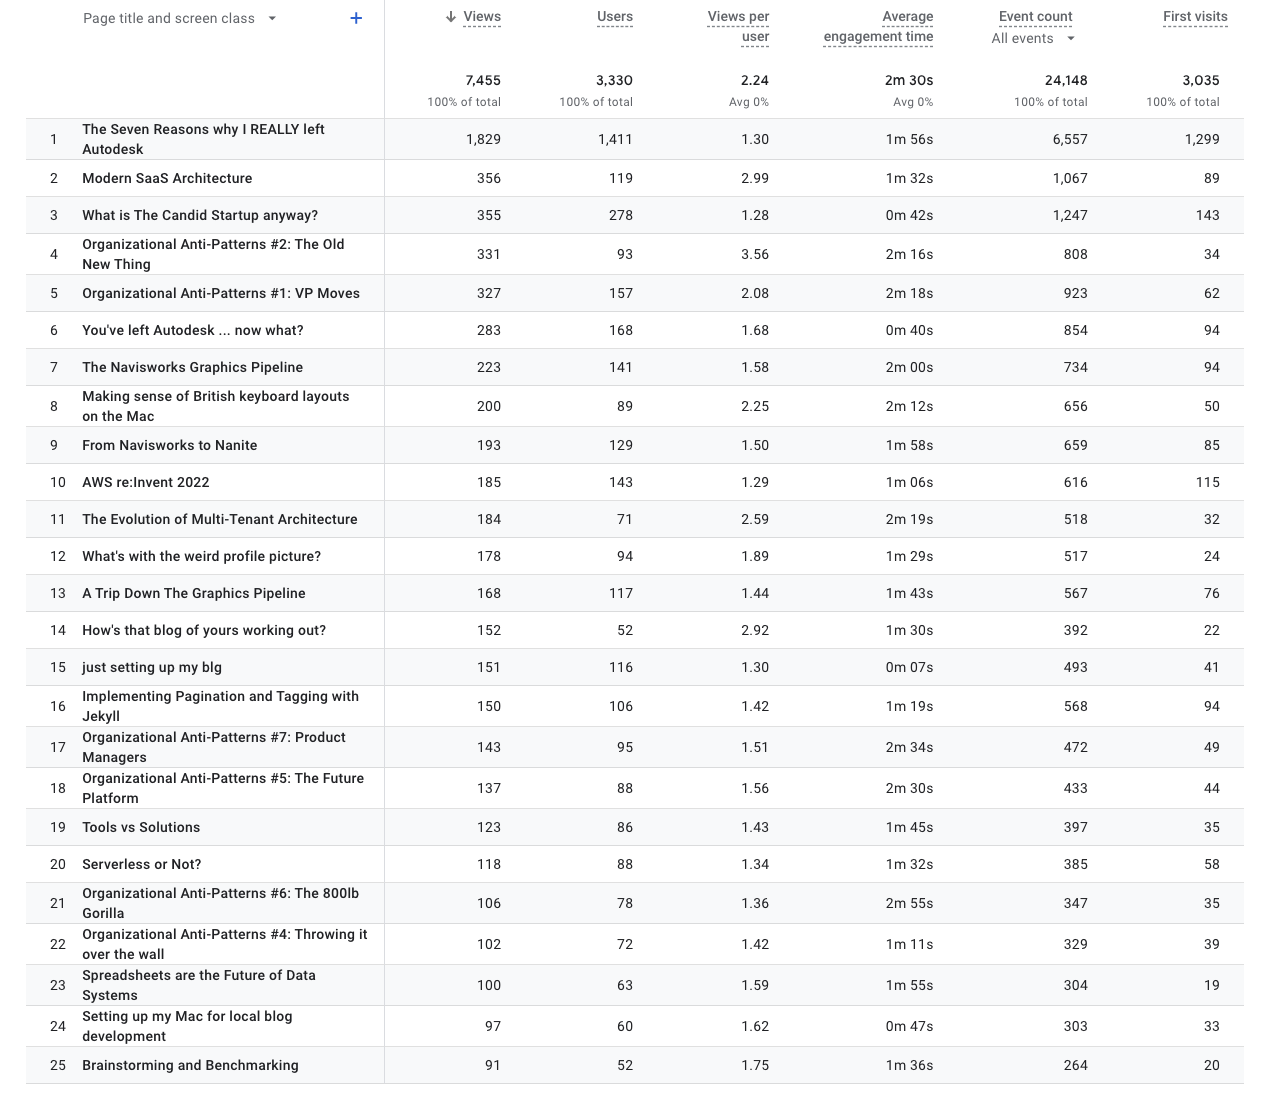

Seven Reasons is, once again, miles out in front at number 1. Most of the top 25 date from the first two quarters. Only the last post in my Organizational Anti-Patterns series and my Computer Graphics posts sneak in.
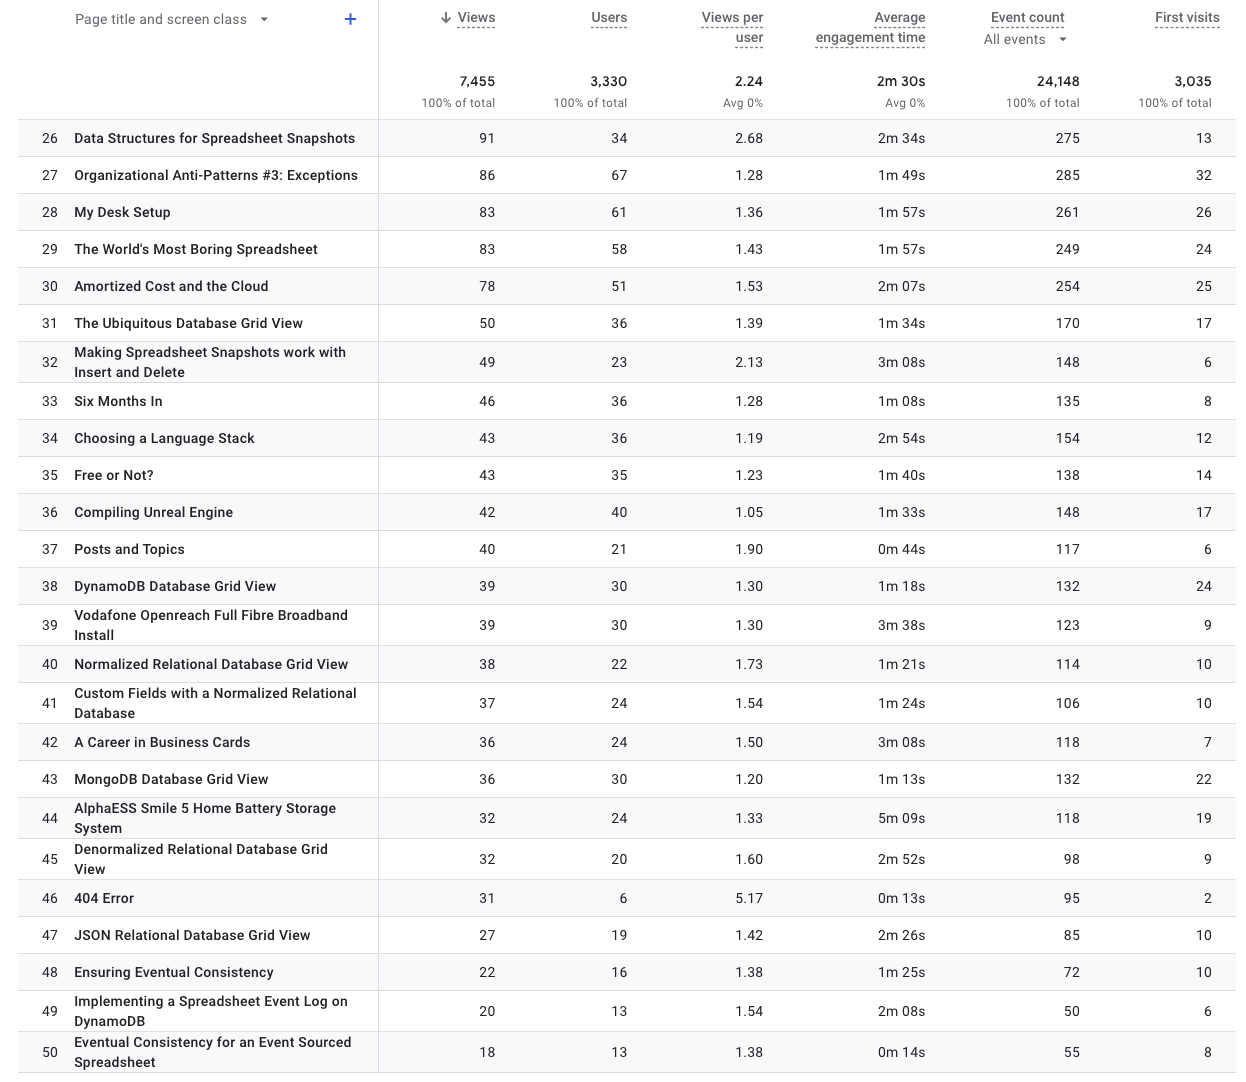

As I’ve made it to 50 posts, I thought I’d round things out by looking at the bottom 25 too. Commiserations to the four posts that were less popular than 404 Error.
Search (September 3rd 2022 - September 3rd 2023)


After six months my total search performance was 4600 impressions resulting in 75 clicks. Another six months and I’ve increased both by an order of magnitude. There’s a worrying dip over the last month, but there does seem to be a lot of natural variation as Google tweak their search algorithms.
Let’s have a look at the most popular pages in terms of Google search impressions.
| Page | Impressions | Position | Clicks | Top Queries |
|---|---|---|---|---|
| Implementing Pagination and Tagging with Jekyll | 12433 | 45 | 118 | “pagination tags”, “pagination tag”, “jekyll pagination”, “jekyll paginate”, “paginate liquid”, “jekyll tags” + 61 more |
| Modern SaaS Architecture | 8707 | 58 | 28 | “saas architecture”, “saas product architecture”, “saas deployment architecture”, “modern saas architecture”, “saas architecture diagram”, “saas applications architecture”, “aws saas architecture”, “saas platform architecture”, “modern saas” + 67 more |
| Making sense of British keyboard layouts on the Mac | 5320 | 22 | 47 | “uk keyboard layout”, “british keyboard”, “mac uk keyboard”, “backslash on uk keyboard”, “karabiner elements windows”, “applause autodesk” + 252 more |
| AWS re:invent 2022 | 2965 | 29 | 27 | “reinvent 4k run”, “aws event driven architecture”, “aws cell based architecture”, “aws replay 2022”, “eventbridge latency”, “aws fault injection simulator az failure”, “shuffle sharding” + 79 more |
| A Trip Down The Graphics Pipeline | 2362 | 23 | 29 | “a trip through the graphics pipeline”, “graphics pipeline”, “gpu pipeline”, “gpu driven rendering”, “graphics pipeline stages” + 59 more |
| From Navisworks to Nanite | 1844 | 18 | 20 | “nanite siggraph”, “nanite lod”, “how does nanite work”, “nanite virtualized geometry”, “nanite occlusion culling”, “nanite draw calls”, “nanite limitations” + 39 more |
| The Navisworks Graphics Pipeline | 787 | 17 | 23 | “graphics pipeline”, “navisworks culling”, “nvidia Ogs”, “navisworks rendering”, “navisworks piping” + 5 more |
| The Candid Startup | 681 | 10 | 125 | “candid startup”, “thecandid”, “the candid”, “startup org”, “candid openreach + 3 more |
It’s always surprising to find where the gaps are in the internet’s collective knowledge. Who knew there were so many people out there confused by the keyboard layout on British Macs? Or how many other bloggers use jekyll and can’t figure out how to paginate their list of posts?
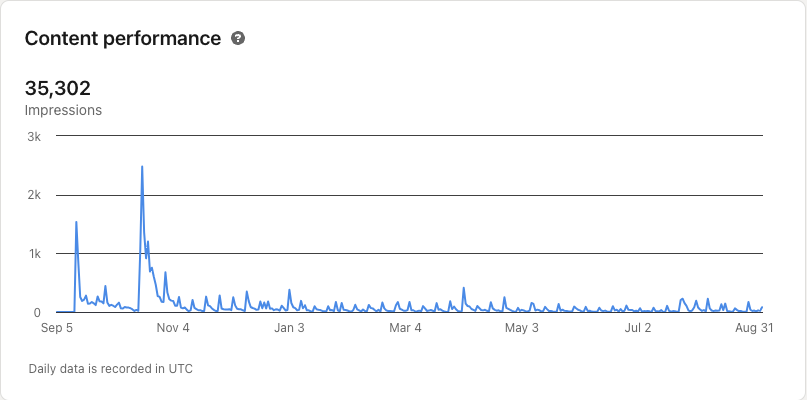

LinkedIn only supports analytics for a few predefined periods. I can look at impressions for the last year or something less than 90 days. There’s nothing much to see from the graph. Two big peaks from my retirement announcement and Seven Reasons post, then bumping along after that.
Let’s try looking at the individual posts that the LinkedIn algorithm liked best.
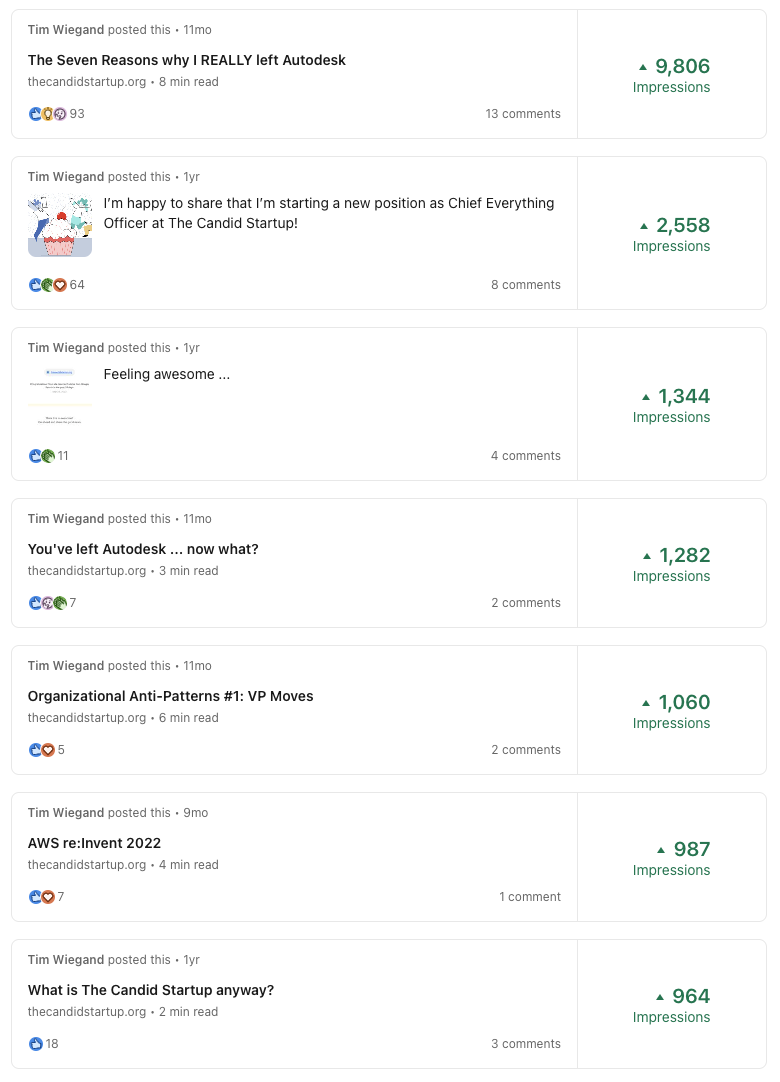

The top 7 (which is all that fits on a page) are all from the first three months. It’s clear that reactions and comments drive LinkedIn to share posts more widely.
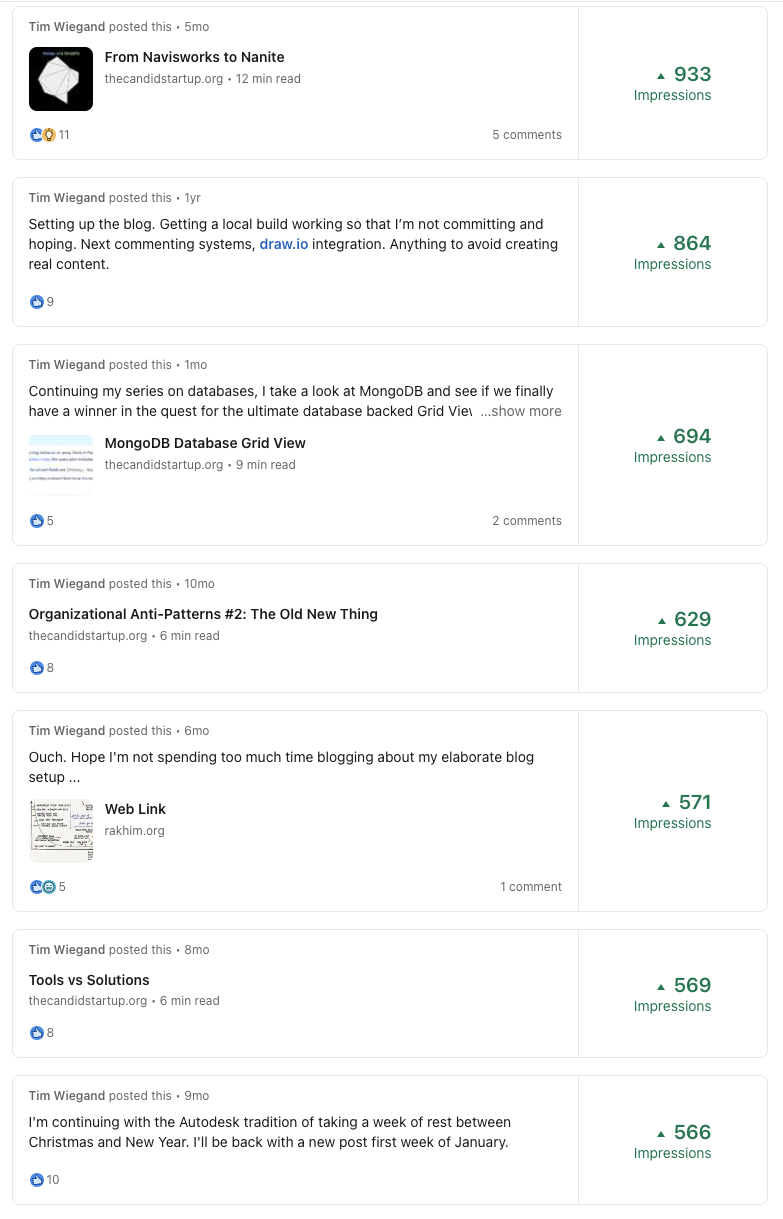

There’s some more recent posts in the next 7. From Navisworks to Nanite clearly resonated with a lot of people, is in the top 10 most visited posts and is also getting traffic from Google.
It’s weird that MongoDB Database Grid View did so well. It came deep in a series of posts on database internals that didn’t get much traction. It’s only my 43rd most popular post. I guess enough people have had bad experiences with MongoDB that they felt moved to react.