This is my hundredth post to the Candid Startup. As this is a special celebration, make sure you stick around until the end for an amazing free giveaway.
It feels like a good opportunity to take stock and reflect on how things have been going. I last did one of these reviews for my one year anniversary, and prior to that after two months and six months.
Clearly I’m slowing down. I fiddle around with open source projects and blog about it for fun. I guess looking at analytics is less fun than it used to be.
In the early days I was curious about the machinery of running a blog. As I’ve grown more familiar with it, I’ve lost interest in seeing which post gets marginally more views than another. I haven’t really looked at the analytics since last year.
I get the occasional email from Google when I hit a new milestone in search performance. Which does give me a little dopamine buzz. Other than that, I’ve been heads down coding.
Engage
Before we get into the graphs and top ten lists, a quick request from me. If you find my posts via LinkedIn or Twitter:
- React, if you have a reaction
- Reply, if you’re feeling more than one of the pre-packaged reactions
If you have a GitHub account, you can leave a comment directly on the blog post itself.
I get an even bigger dopamine buzz than automated emails from Google when I see real people engaging with the blog.
Analytics
All analytics are from the last 12 months. At time of capture, that’s 19th August 2023 - 19th August 2024. Where relevant, I’ve compared against the previous 12 months, which covers the complete lifetime of the blog.
Users
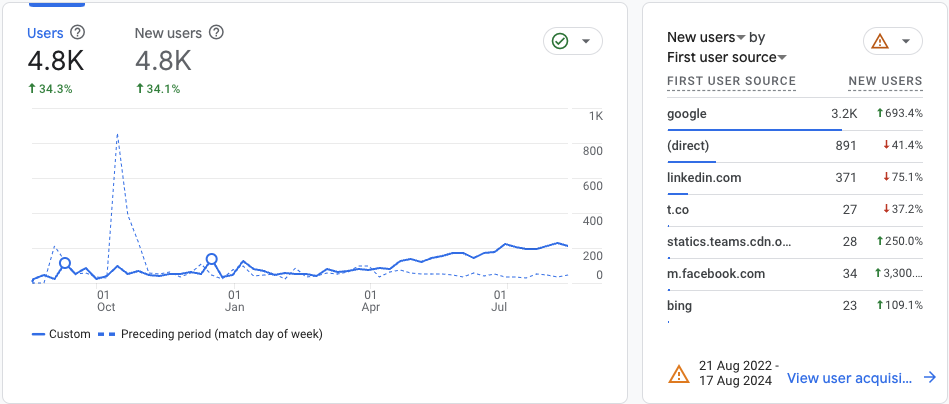
I should have looked sooner. All kinds of interesting things going on.
Last year I was starting to see a shift in source of traffic towards Google Search. When I started the blog, almost everyone came from the links I posted on LinkedIn and Twitter. I still do that but to ever decreasing effect. A year ago, LinkedIn and direct traffic were neck and neck with Google. This year, they’ve been blown out of the water. New this year, is a small but significant amount of traffic from Microsoft Teams, Facebook and Bing. I have no idea how my stuff ended up on Facebook.
It’s strange that all users appear to be new users. Maybe Google Analytics is having trouble with tracking users, perhaps due to privacy preserving browsers. Alternatively, with the big increase in traffic via search, maybe most users are now one time visitors.
The huge spike at the beginning of last year is my never to be exceeded, “viral on LinkedIn”, Seven Reasons why I REALLY left Autodesk post. After that things had been fairly flat until April of this year. Since then, unique users have steadily climbed to over 200 a week.
Finally, Google Analytics has a new feature. The two circles on the graph represent anomalies where there were 150% week over week increases in visitors. These weeks correspond to posting my One Year Anniversary and Legal Jeopardy posts. We’ll see where they rank when we look at the post analytics later.
Demographics
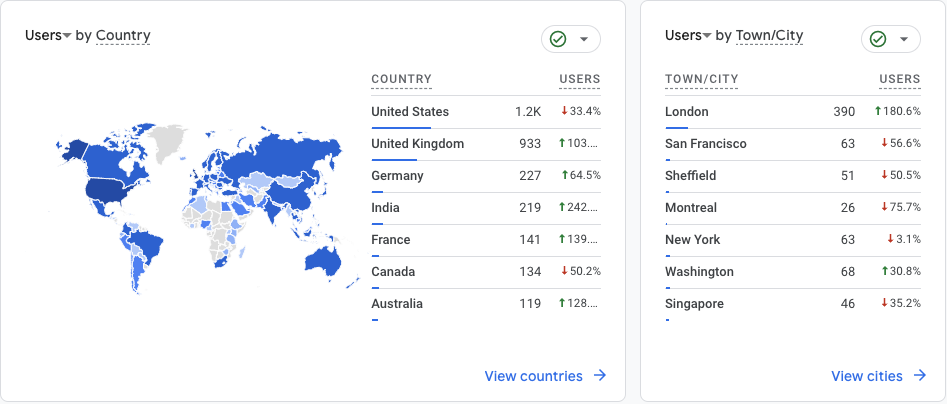
Overall demographics, as summarized by the map, look similar to last time. However, there’s been a huge shift in the proportions of users in different countries and cities. There’s a massive jump in users from the United Kingdom and London. India has gone from nowhere to fourth place.
Posts
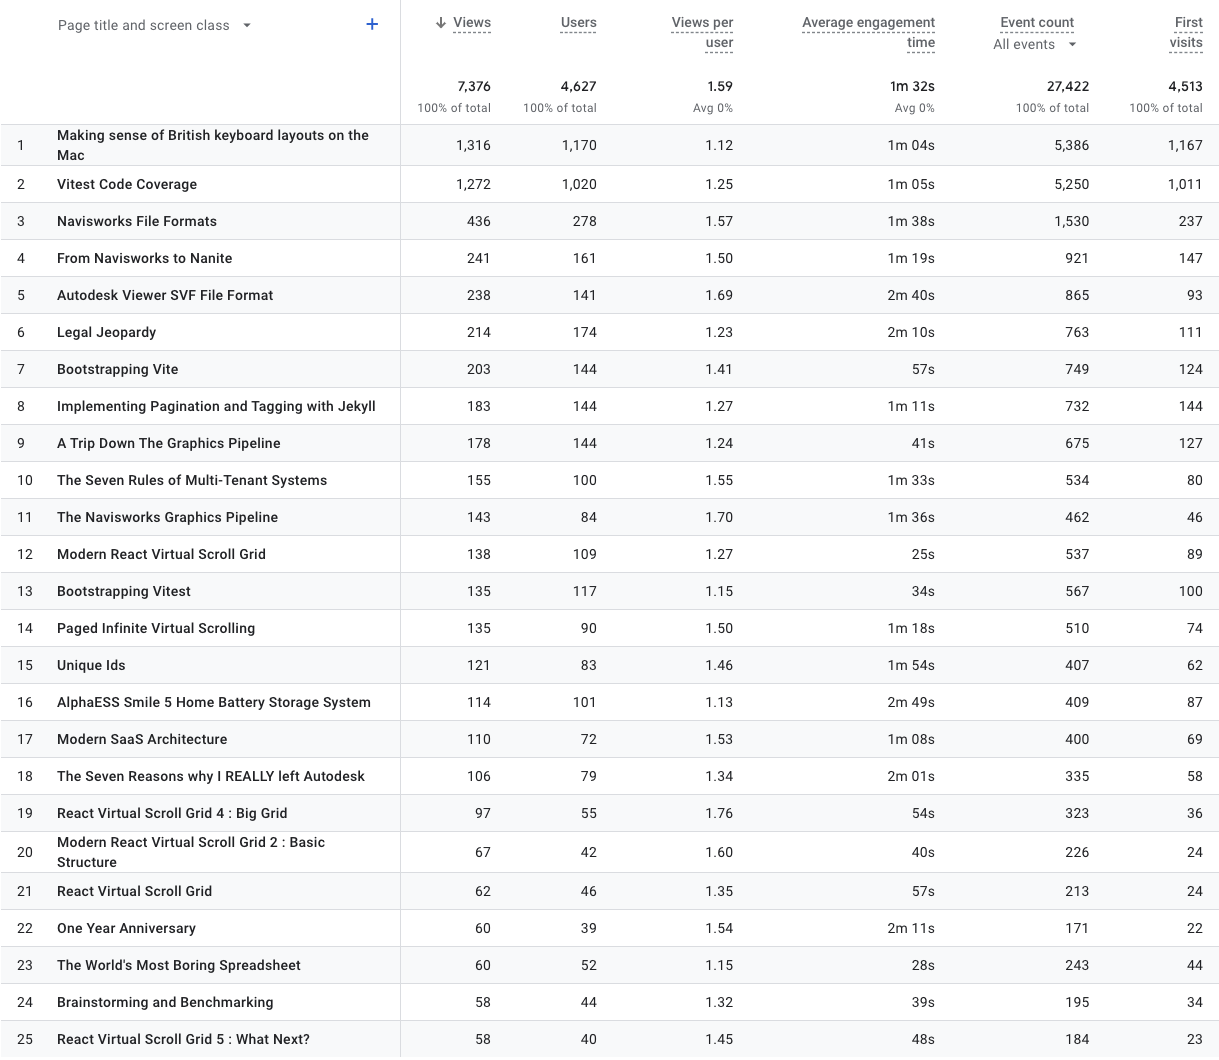
Drum roll please. It’s time for the top 25 posts over the last 12 months. Finally, I get a ranking where Seven Reasons why I REALLY left Autodesk isn’t on top. Don’t worry, it’s still number one over the lifetime of the blog, and lands at a respectable 18th for a post that’s nearly two years old.
Which is why it’s such a shock that the number one post during the last 12 months is even older! Now I know where all those additional United Kingdom users have come from. They’re all having trouble figuring out how to use the keyboard on a UK Mac.
Unbelievably, running it a close second, is a very technical post on setting up code coverage for the Vitest unit testing tool. I’m beginning to get a sense for what the most popular Google Search queries are likely to be.
The next three places are posts from a brief potter into the world of computer graphics. Maybe I should revisit.
Finally, Legal Jeopardy is 6th, and One Year Anniversary is 22nd. Legal Jeopardy got 6 times as many views as the previous weeks post, which explains the anomaly that Google flagged up.
The other anomaly is more complex. One Year Anniversary wasn’t that popular. However, the week that I posted it saw a big jump in views for a handful of older posts. I suspect that Google may have indexed a bunch of additional pages that week.
Google Search
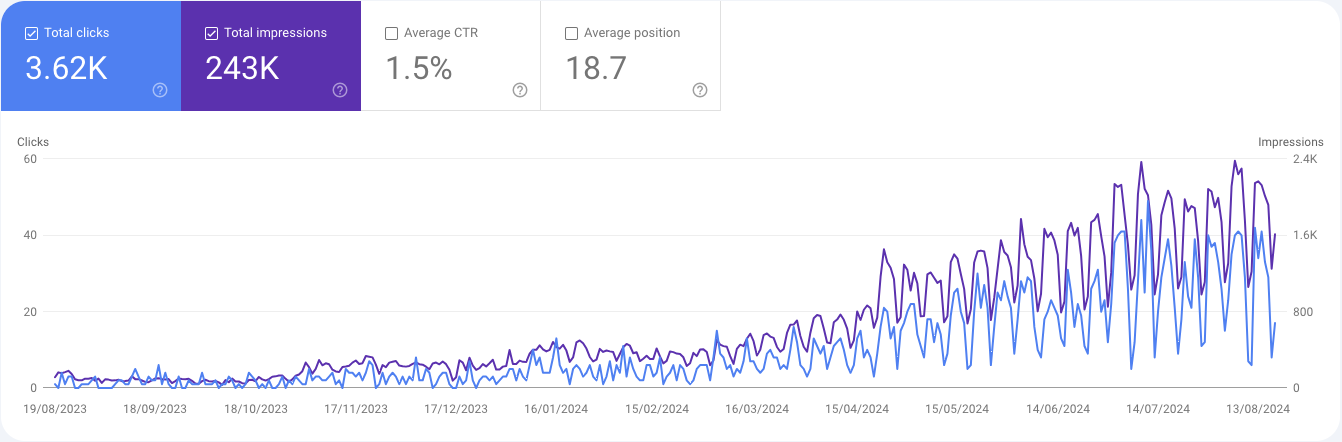
Wow. Compared to last year, I’m getting six times as many impressions and clicks. My average position in the search results has jumped from 39 to 19. For some reason, everything has ramped up significantly over the last few months. It’s clear that this is where the growth in user visits has come from.
I put a little bit of effort in at the end of April, trying to improve the number of pages being indexed. I requested a new crawl of the site through the Google Search Console a couple of times. I use my RSS feed as the sitemap for Google Search. I noticed that it only included the most recent 20 posts. I increased it to 100 posts and resubmitted it. Maybe there was an effect or maybe it’s just another change in Google’s algorithm.
Let’s have a look at the 10 pages with the highest number of impressions. Just for fun, I’ve also included The Candid Startup home page.
An impression is counted each time a link to that page appears in Google Search’s results. I also capture the average position within the results and, in bold, the highest position achieved for that page with the right query. You can then see how many times people clicked through to visit the page.
I’ve changed the way I track the queries being used. It’s no longer practical to report a list of actual queries. The most popular pages have over a thousand different queries (Google Search Console stops counting at 1000). Instead, I’ve extracted the most significant keywords used in queries.
I used a Google Search Console regexp query to explore the space of keywords, for example mac|apple|keyboard|layout. You can filter by queries that don’t match the regexp to discover keywords that you might have missed. You can then use expressions like (((keyboard|layout)\s*){2})+ to find all queries that use a combination of keywords in any order.
I show the percentage of impressions queried using each keyword. Keywords in bold are those included in the query that gets the highest position in the search results. Keywords in italic are used less than 1% of the time but are relevant to the content of the page.
| Page | Impressions | Position | Clicks | Query Keywords |
|---|---|---|---|---|
| Making sense of British keyboard layouts on the Mac | 129996 | 21 (5) | 1282 | keyboard(94%), mac(57%), layout(53%), uk(37%), british(13%), apple(6%), english(3%), backslash(3%), karabiner, hidutil, applause, autodesk |
| Vitest Code Coverage | 39618 | 9 (3) | 1075 | vitest(89%), coverage(87%), v8(26%), istanbul(13%), vs(6%), vite(3%) |
| Navisworks File Formats | 15605 | 11 (7) | 140 | file(86%), navisworks(64%), format(45%), type(38%), nwd(27%), extension(12%), nwc(3%), nwf(3%), import(2%) |
| Bootstrapping Vitest | 8421 | 18 (5) | 100 | vitest(80%), found(28%), files(25%), exiting(18%), dependencies(12%), vite(12%), config(10%), window(7%), jsdom(3%) |
| A Trip Down The Graphics Pipeline | 6714 | 22 (8) | 123 | pipeline(93%), graphics(66%), trip(20%), gpu(16%), rendering(13%), down(9%), shader(1%), unified(1%) |
| Bootstrapping Vite | 5473 | 14 (9) | 135 | vite(97%), bootstrap(82%), react(37%), localhost(2%), asdf(1%), rollup |
| Implementing Pagination and Tagging with Jekyll | 5337 | 29 (11) | 136 | pagination(96%), tag(66%), jekyll(35%), liquid(1%) |
| From Navisworks to Nanite | 4807 | 17 (6) | 69 | nanite(95%), gpu driven material(27%), visibility buffer(14%), siggraph(11%), virtualized geometry(9%), lod(7%), culling(6%), cluster(5%), unreal(2%), pipeline(1%), texture(1%), imposter |
| Modern React Virtual Scroll Grid | 3421 | 16 (12) | 80 | scroll(86%), react(60%), virtual(58%), react-window(12%), grid(8%), horizontal(4%), modern(3%) |
| Modern SaaS Architecture | 3330 | 60 (5) | 7 | sass(96%), architecture(87%), diagram(13%), modern(10%), platform(9%), infrastructure(6%), service(6%), aws(5%), upstream(3%), downstream(3%) |
| The Candid Startup | 1826 | 22 (1) | 83 | candid(99%), the(61%), startup(14%) |
Google Search Console doesn’t capture the query used for every impression. For these pages the proportion of impressions with query data varies between 15% (From Navisworks to Nanite) and 80% (Modern SaaS Architecture). No idea why it varies so much. I’m assuming the captured queries are representative.
While pulling the data together, I did occasional spot checks by running a query myself. I quickly realized I need to use incognito mode. I found this near the top of the search results for “mac keyboard layout”. Google knows when I’m googling myself.
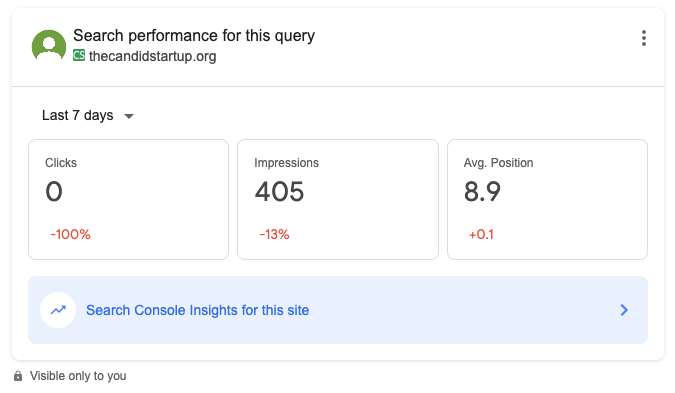
Making sense of British keyboard layouts on the Mac
My number one post. More impressions than all the rest of my content put together. Google has decided that I’m one of the foremost authorities on the UK Mac keyboard layout. The query data includes every conceivable combination of common keywords. Most queries include 3 of the 4 most popular. You need all 4 to get a position above the fold in the results.
Vitest Code Coverage
My other blockbuster post. It has a third of the impressions but almost as many clicks, demonstrating how important it is to get a high position in the results. The subject matter is technical but clearly there are lots of people out there who want someone to tell them whether to use Istanbul or v8 when setting up code coverage in Vitest.
Navisworks File Formats
Out of my most searched for posts, this is the one I’m most qualified to write. I created and implemented the Navisworks file formats. Which is why it’s so annoying that it has a below average click through rate. What are people looking for when they search for “navisworks file format”?
Bootstrapping Vitest
The queries used for the previous three pages were all random combinations of common keywords. This one’s different. People were clearly searching for help with common Vitest errors.
- “vitest no test files found, exiting with code 1”
- “vitest window is not defined”
- “vitest referenceerror: document is not defined”
- “re-optimizing dependencies because vite config has changed”
- “vitest expect is not defined”
The post does quote the most queried error exactly and explains what it means. So, well done Google for sending them my way.
A Trip Down The Graphics Pipeline
There’s a famous computer graphics book by Jim Blinn called A Trip Down the Graphics Pipeline, which I was riffing on with the title of this post. Others have done the same. For example, there’s a great series of posts from 2011 called A trip through the Graphics Pipeline.
There’s the usual random combination of keyword queries but the top two by a long way are “a trip down the graphics pipeline” and “a trip through the graphics pipeline”.
I hope they weren’t too disappointed if they clicked through to my post.
Bootstrapping Vite
Another case of mistaken identity. I’m using the term “bootstrapping” with the sense of getting started with something and getting it working for the first time. The queries show that most people were actually looking for advice on using Vite with the Bootstrap toolkit.
Implementing Pagination and Tagging with Jekyll
Last year this was my most searched for post. This year it’s getting half the number of impressions but with a much higher results position resulting in the same number of clicks.
For most pages, the query that gives the highest position in the results is the one that includes all the most popular keywords. Here, adding “tag” drops the position down by 20 places. That’s despite the content including extensive coverage of both topics.
From Navisworks to Nanite
Most people search using simple keywords. Computer graphics nerds clearly prefer to search using key phrases. The best query was “nanite” + “visibility buffer”, closely followed by “nanite” + “gpu driven material”.
Modern React Virtual Scroll Grid
My react-virtual-scroll package is a re-implementation of the react-window package using modern React. For some reason, the best performing query is from people looking for advice on how to use react-window for horizontal scrolling.
Modern SaaS Architecture
This post wins the prize for the most abysmal click through rate at just 0.2%. It is not the droid you’re looking for.
Most queries tuck it away many pages down the list of results. However, according to Google Search Console, it appears at number 5 when you use “modern saas architecture”. When I tried it myself it appeared at number 31.
There’s something about this post that breaks Google’s algorithm. Google Search Console has previously reported it at number 1 for a surprising number of different queries, none of which I could reproduce.
The Candid Startup
My average position gets pulled down by the surprising number of queries for “candid” that return a result for my blog a long way down. Every other combination of keywords has an above the fold result. I hit the jackpot with “the candid startup”, the top 10 results all being links to the blog, my GitHub organization, my LinkedIn profile or Twitter (currently known as X).
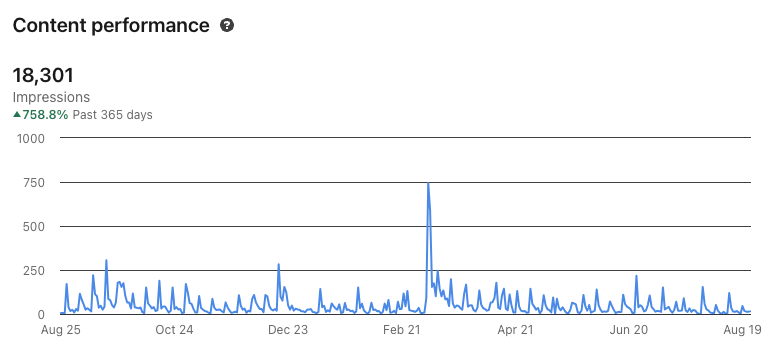
LinkedIn impressions continue to bump along the bottom. The odd post gains some traction which results in extra impressions for subsequent posts until the ripples die away and everything goes back to normal.
Let’s see which posts made a splash over the past year.
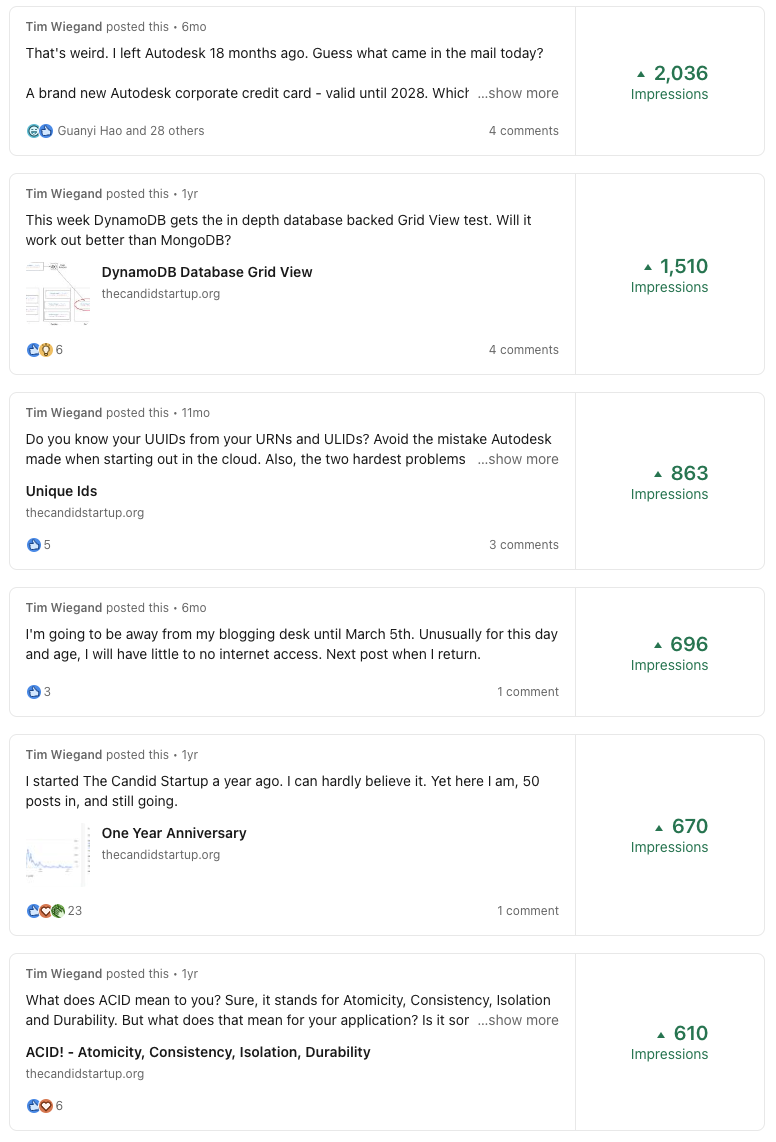
My most popular post by a mile was an off the cuff comment about receiving a new Autodesk corporate card 18 months after leaving Autodesk. My out of office notification in March also did surprisingly well.
The top blog posts are all a year old. Somehow a couple of posts from my very technical database series have gained some traction. At the time nobody seemed interested.
LinkedIn only supports analytics for a few predefined periods. The next step if I want to zoom in is to look at the last 90 days.
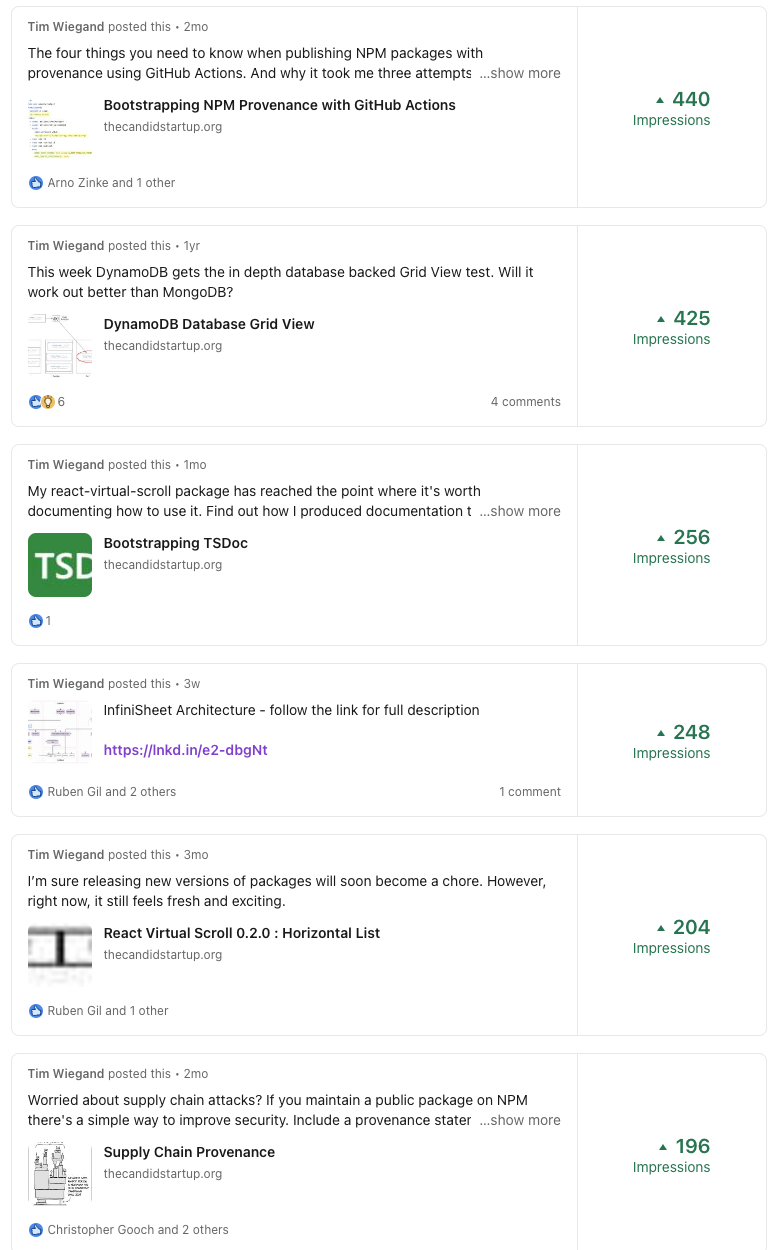
Top post was another very technical article on publishing NPM packages with provenance. You’ll have to read the post if you want to know what that means. Was it the more clickbait description tantalizing you with the “four things you need to know”? Or is there a pent up demand on LinkedIn for solutions to supply chain attacks?
The big shock is that DynamoDB Database Grid View is still getting more impressions than most new posts. What is going on with the LinkedIn algorithms?
Free Giveaway!
Well done for making it this far. Or at least for working out how the scroll bar works.
It’s the meme of the summer. And how better to show just how “brat” you are than by downloading this exclusive brat-themed Candid Startup wallpaper. What will you do with yours?